The Pittsburgh Press (November 5, 1944)
How states have voted in last six elections
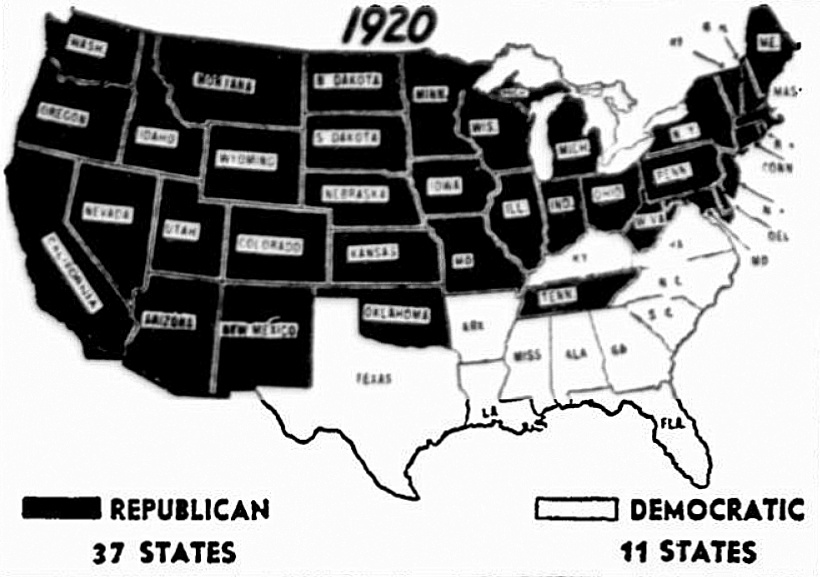
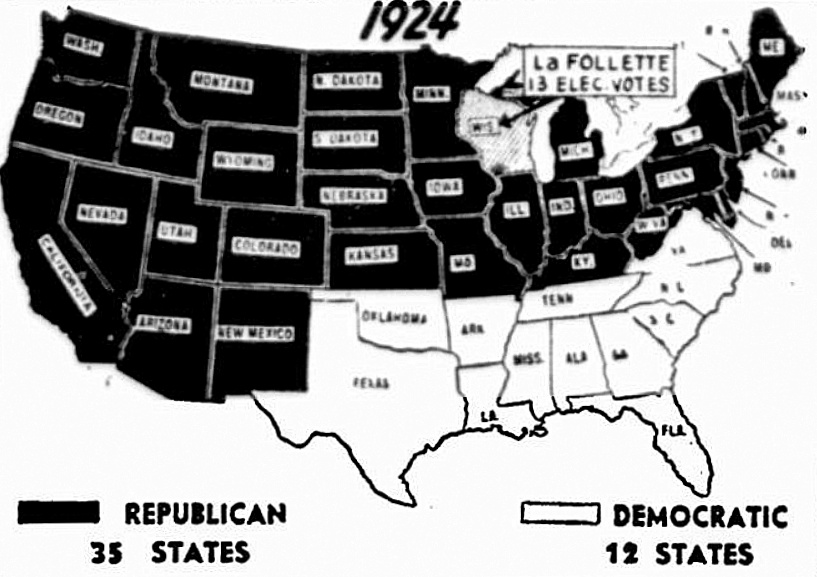
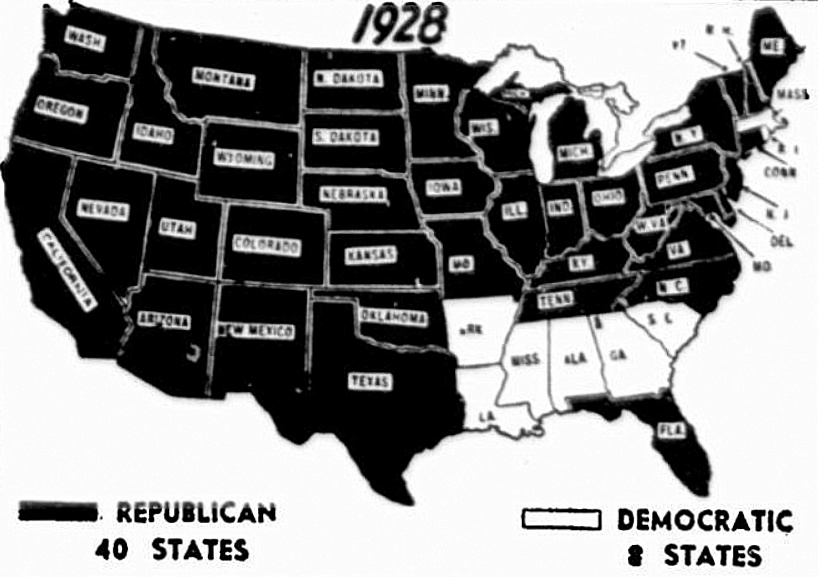
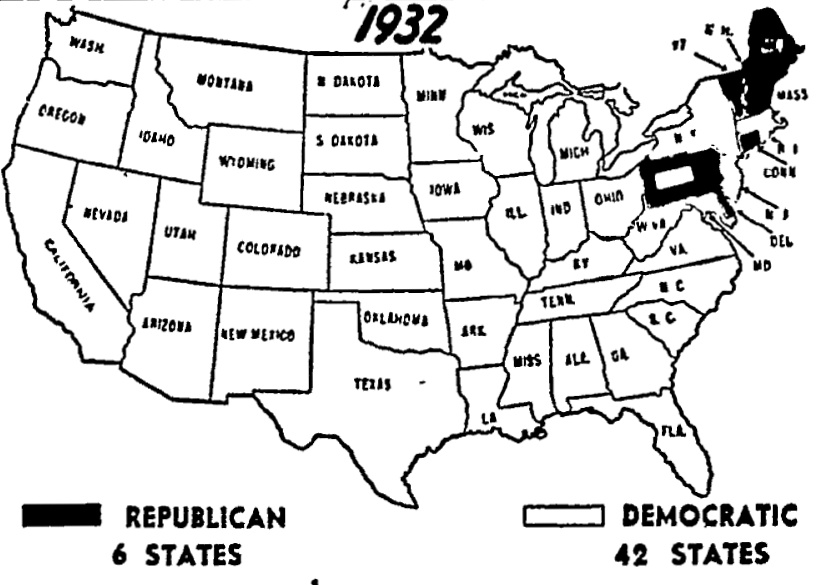
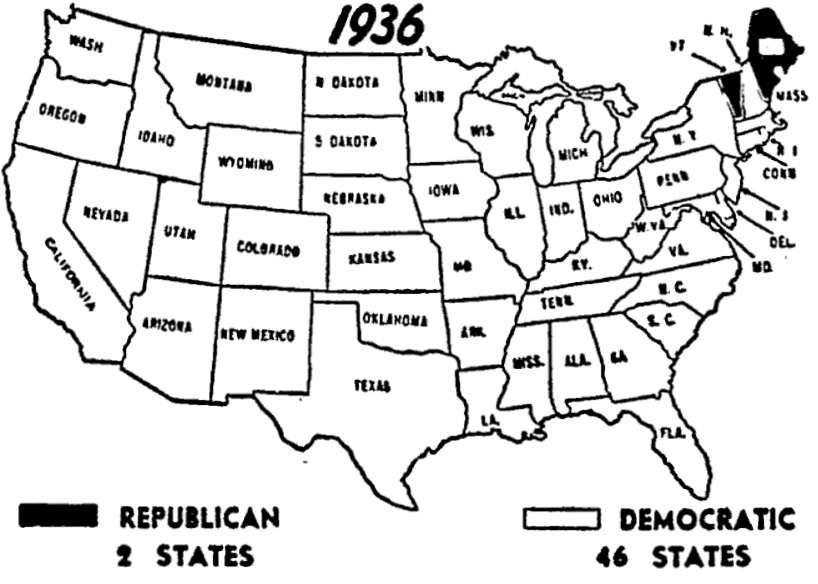
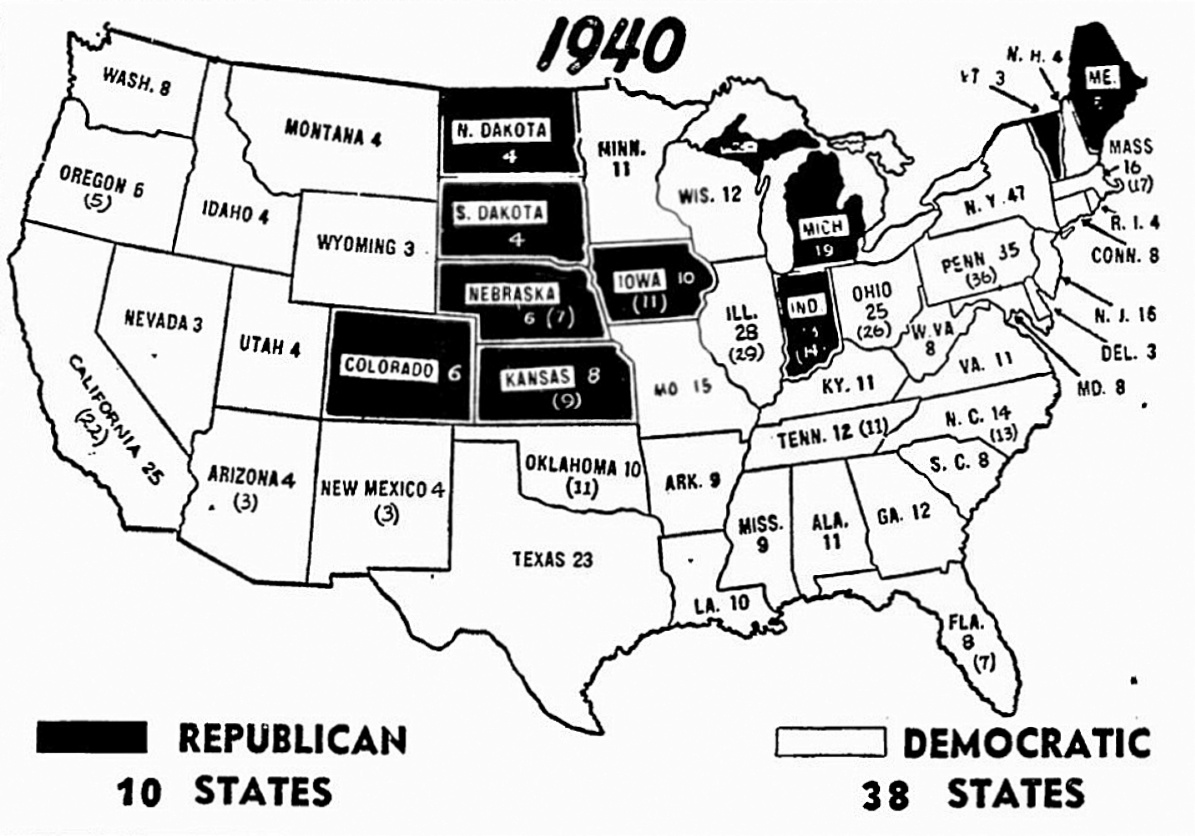
In the presidential elections since the end of World War I, each major political party has been victorious three times, the Republicans in the three elections held in the 1920s and the Democrats in 1932, 1936 and 1940. These maps show how the states have cast their votes. It is interesting to note the sharp increase in the total vote cast since the low marks of the early 1920s when fewer votes were cast for both candidates than were cast for President Roosevelt alone in 1940.
On the large map below the 1944 electoral votes of the states are given beside the name of the state. In parenthesis on 16 of the states are the electoral votes which the states had in 1940. The electoral vote total is changed at the end of the national census every 10 years. The total of 531 remains unchanged but some of the state figures are altered with shifts in population. Pennsylvania, for instance, in 1940 had 36 electoral votes. This year, it has 35.
| Popular | Electoral | |
|---|---|---|
| Warren G. Harding (R) | 16,152,200 | 404 |
| James M. Cox (D) | 9,147,353 | 127 |
| Popular | Electoral | |
|---|---|---|
| Calvin Coolidge (R) | 15,725,016 | 382 |
| John W. Davis (D) | 8,385,586 | 136 |
| Popular | Electoral | |
|---|---|---|
| Herbert Hoover (R) | 21,392,190 | 444 |
| Alfred E. Smith (D) | 15,016,443 | 87 |
| Popular | Electoral | |
|---|---|---|
| Franklin D. Roosevelt (D) | 22,821,857 | 472 |
| Herbert Hoover (R) | 15,761,841 | 59 |
| Popular | Electoral | |
|---|---|---|
| Franklin D. Roosevelt (D) | 27,476,637 | 523 |
| Alfred M. Landon (R) | 16,579,583 | 8 |
| Popular | Electoral | |
|---|---|---|
| Franklin D. Roosevelt (D) | 27,243,466 | 449 |
| Wendell Willkie (R) | 22,304,755 | 82 |